SortWaste: A Densely Annotated Dataset for Object Detection in Industrial Waste Sorting

Sara Inácio1, Hugo Proença1, 2, João C. Neves1, 3

1University of Beira Interior
2IT: Instituto de Telecomunicações
3NOVA Lincs

Introduction

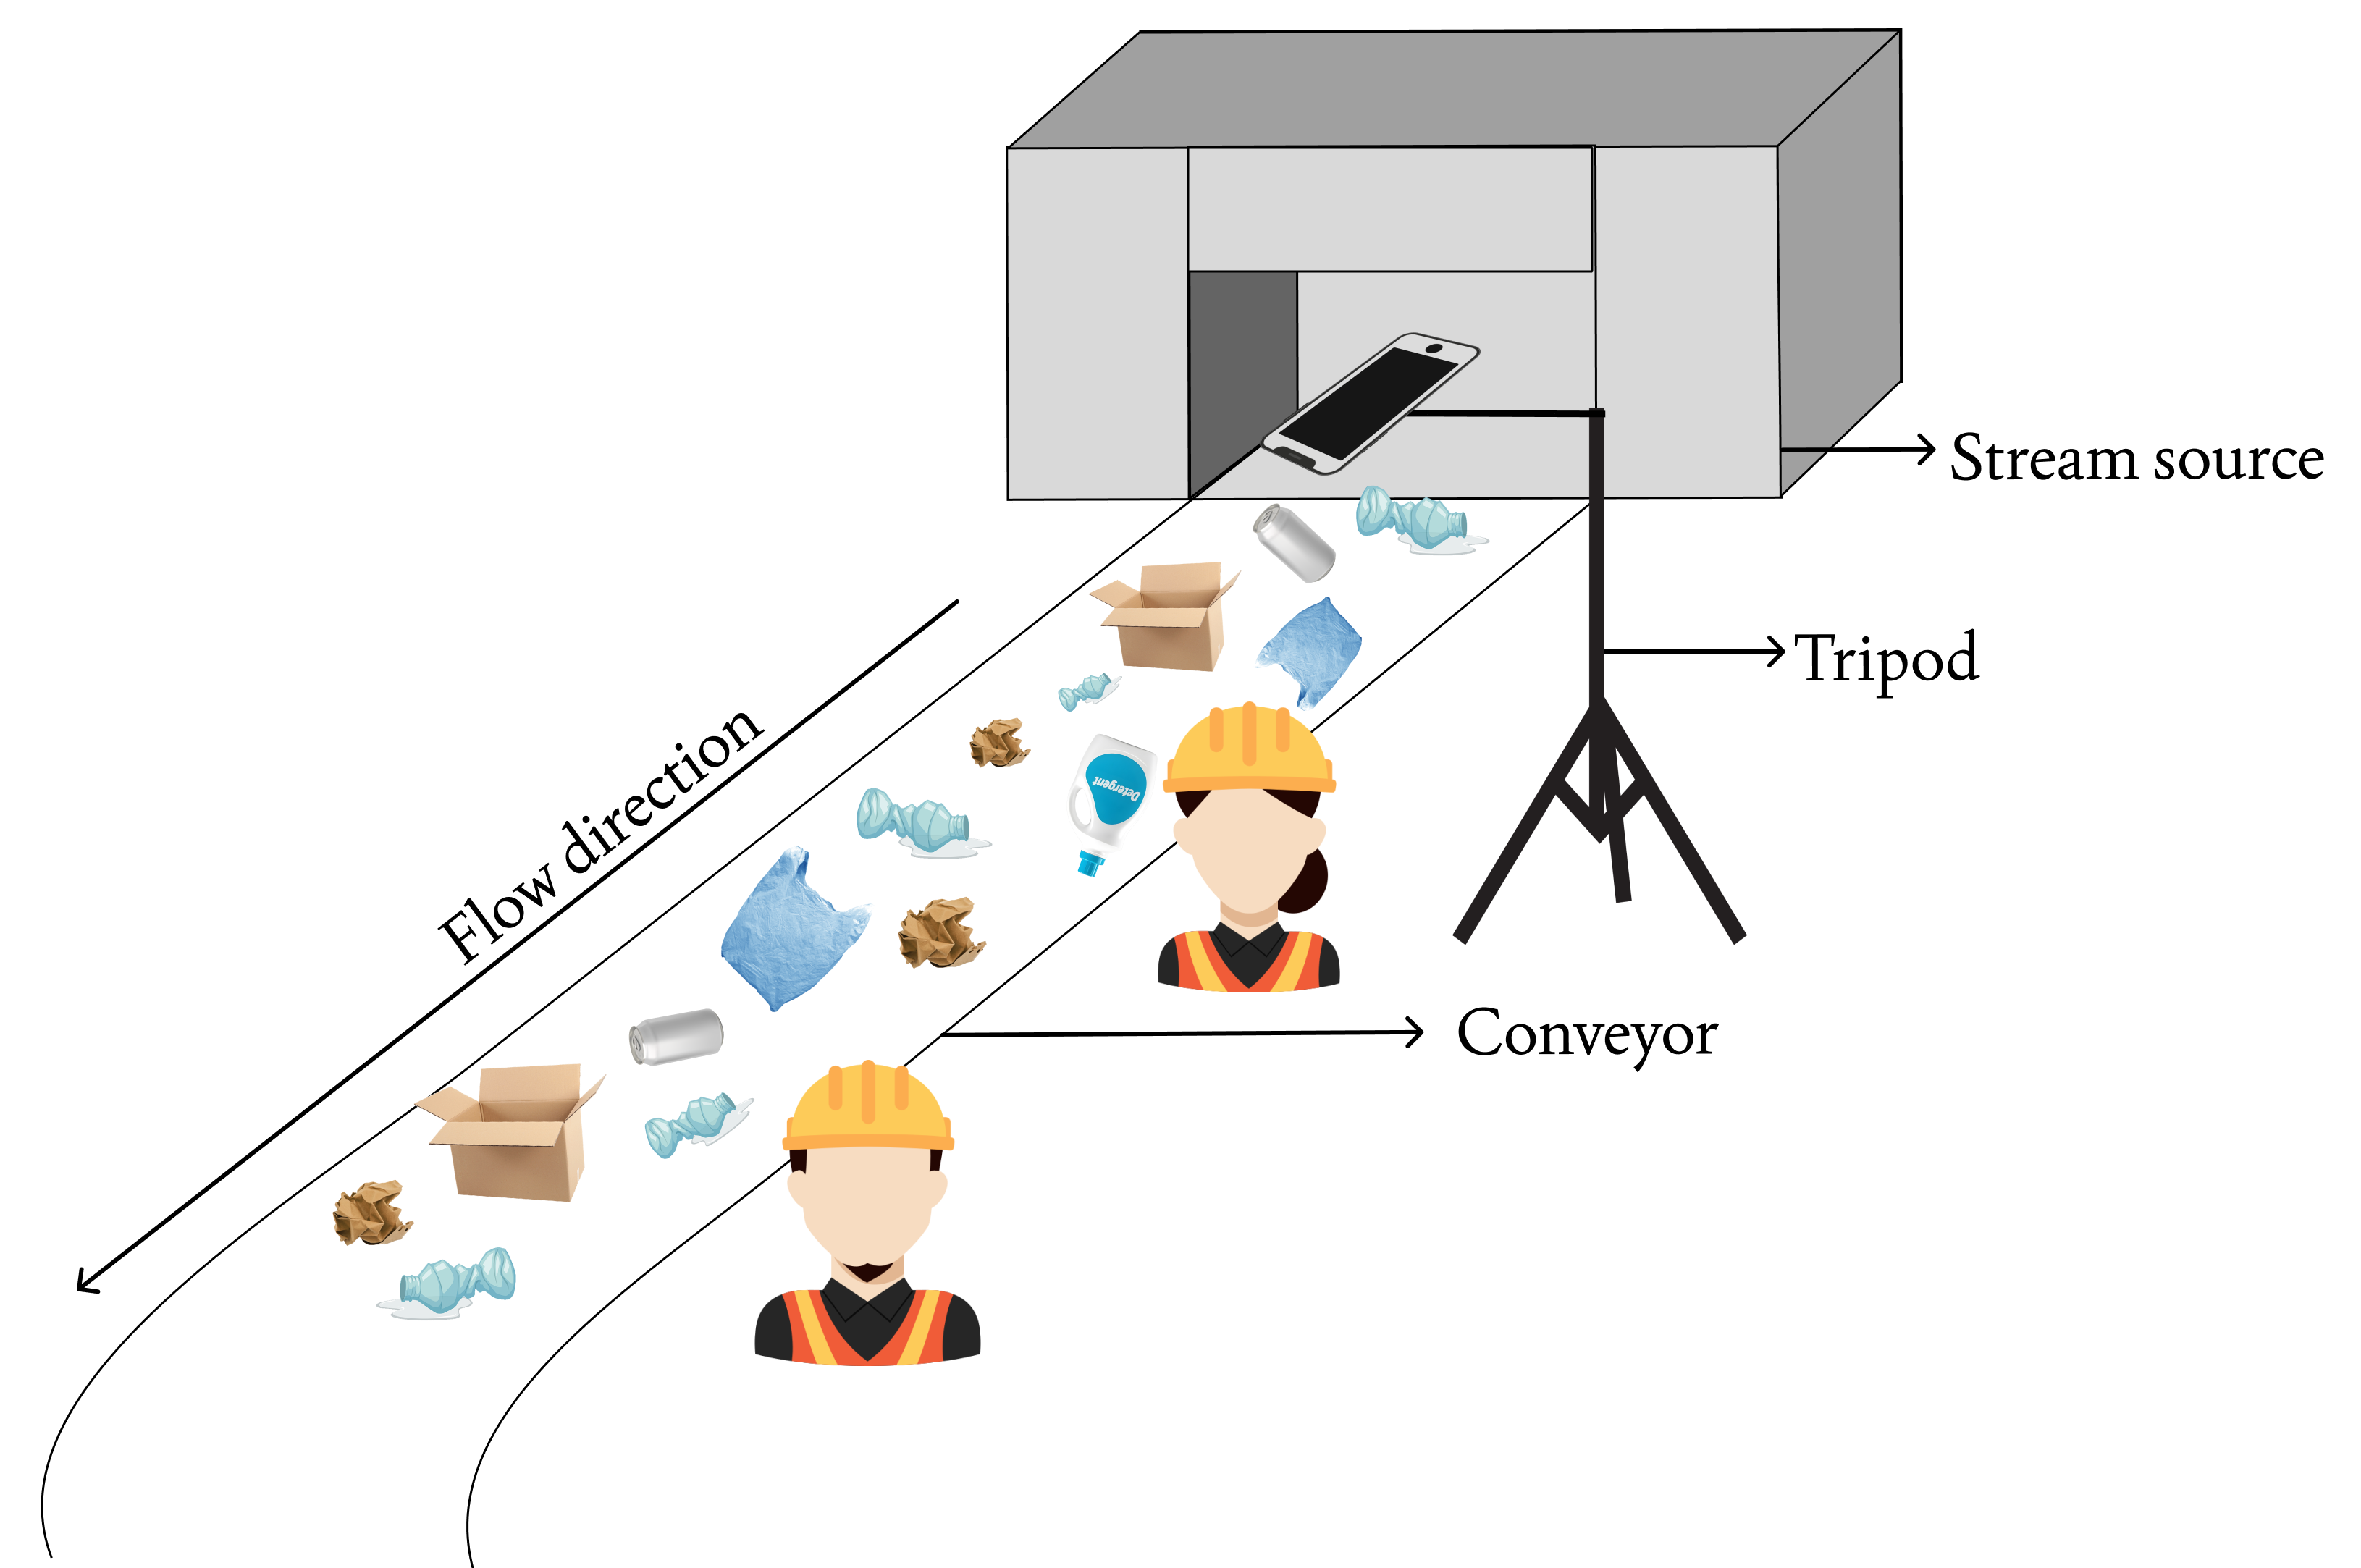
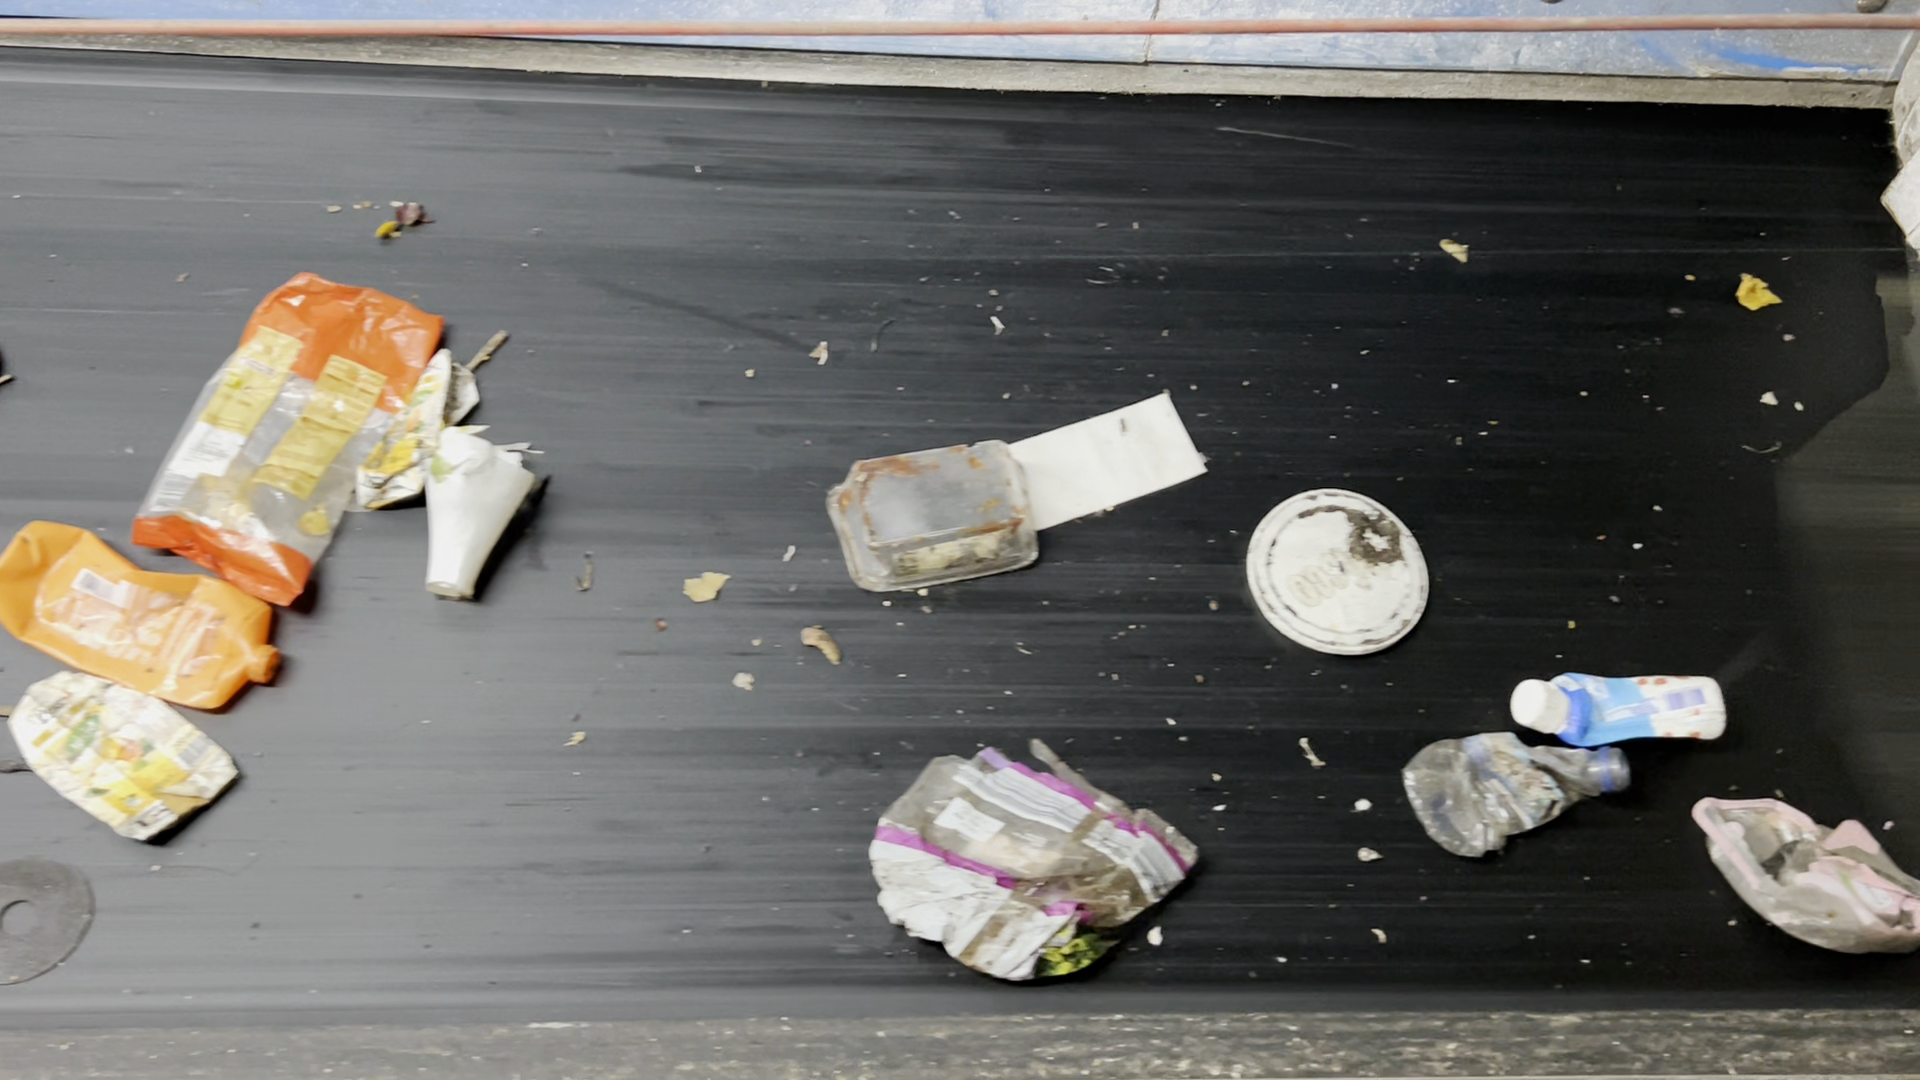
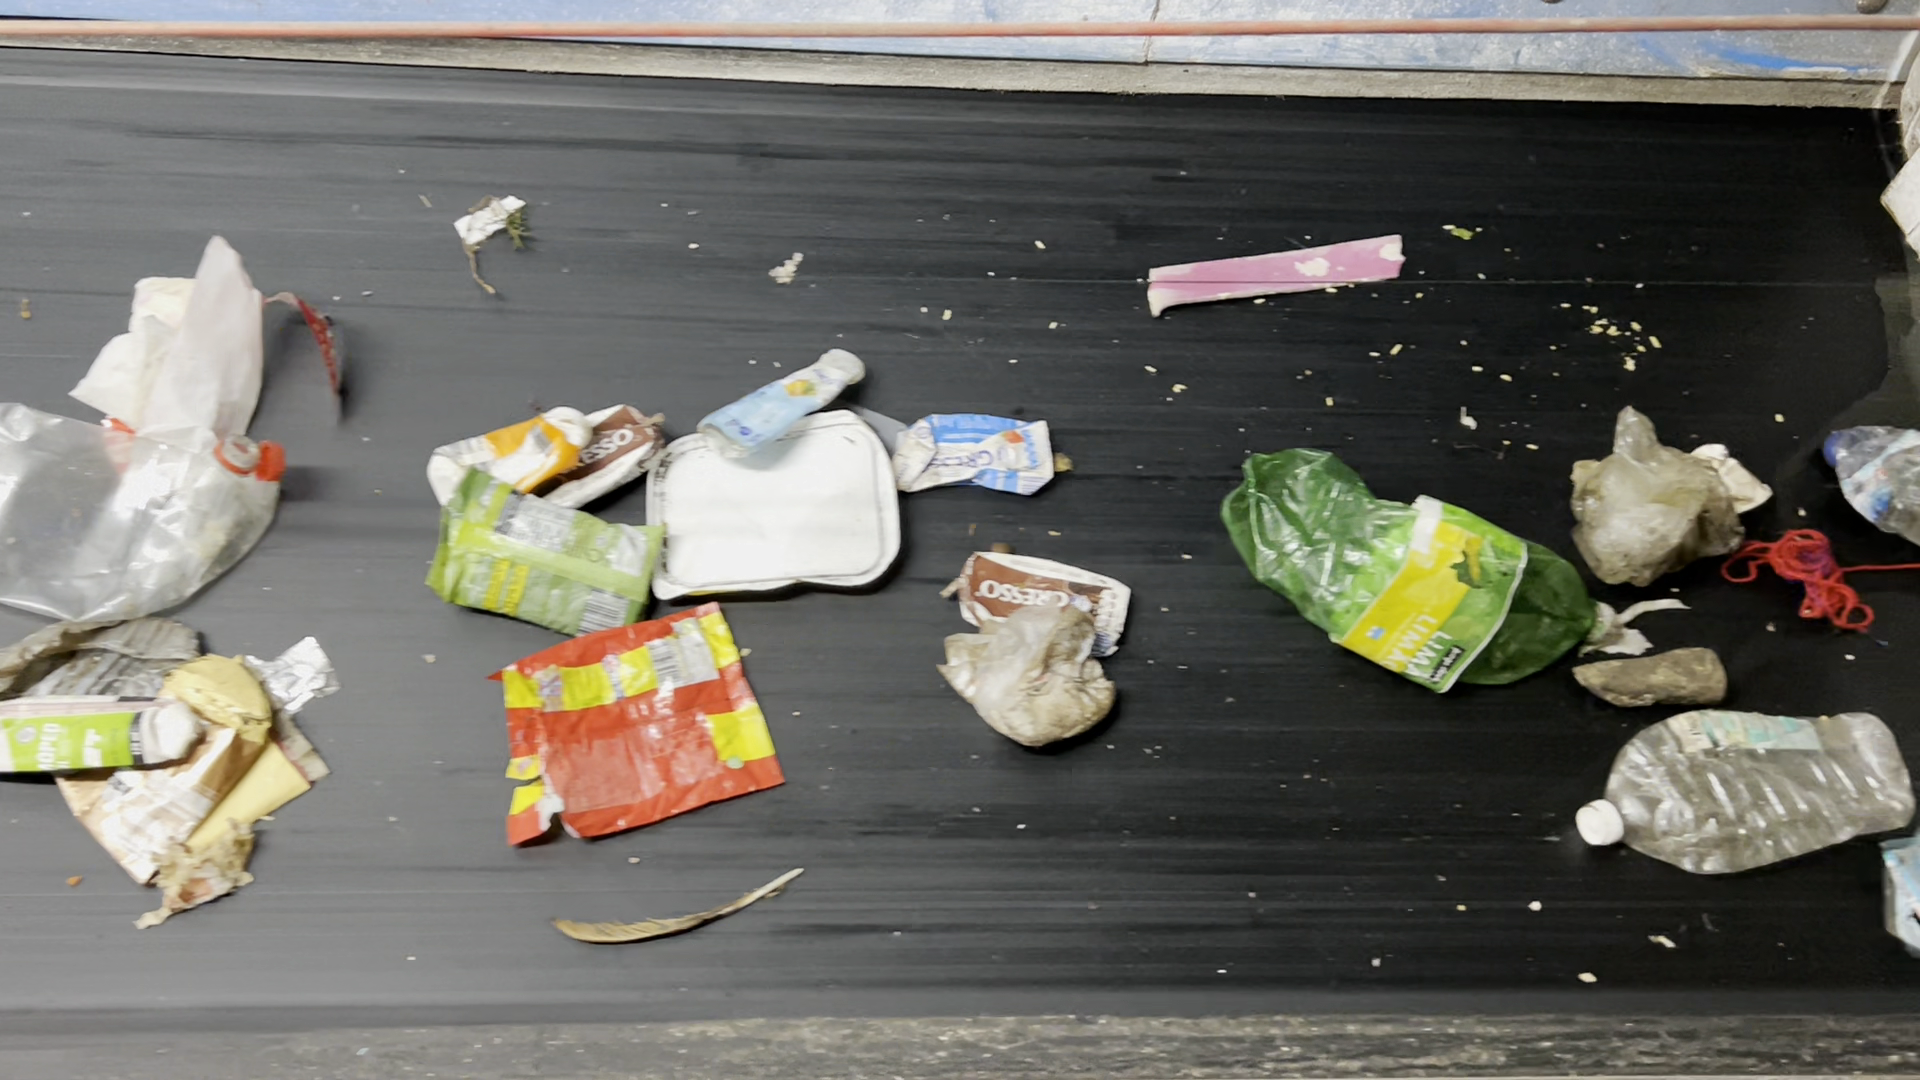
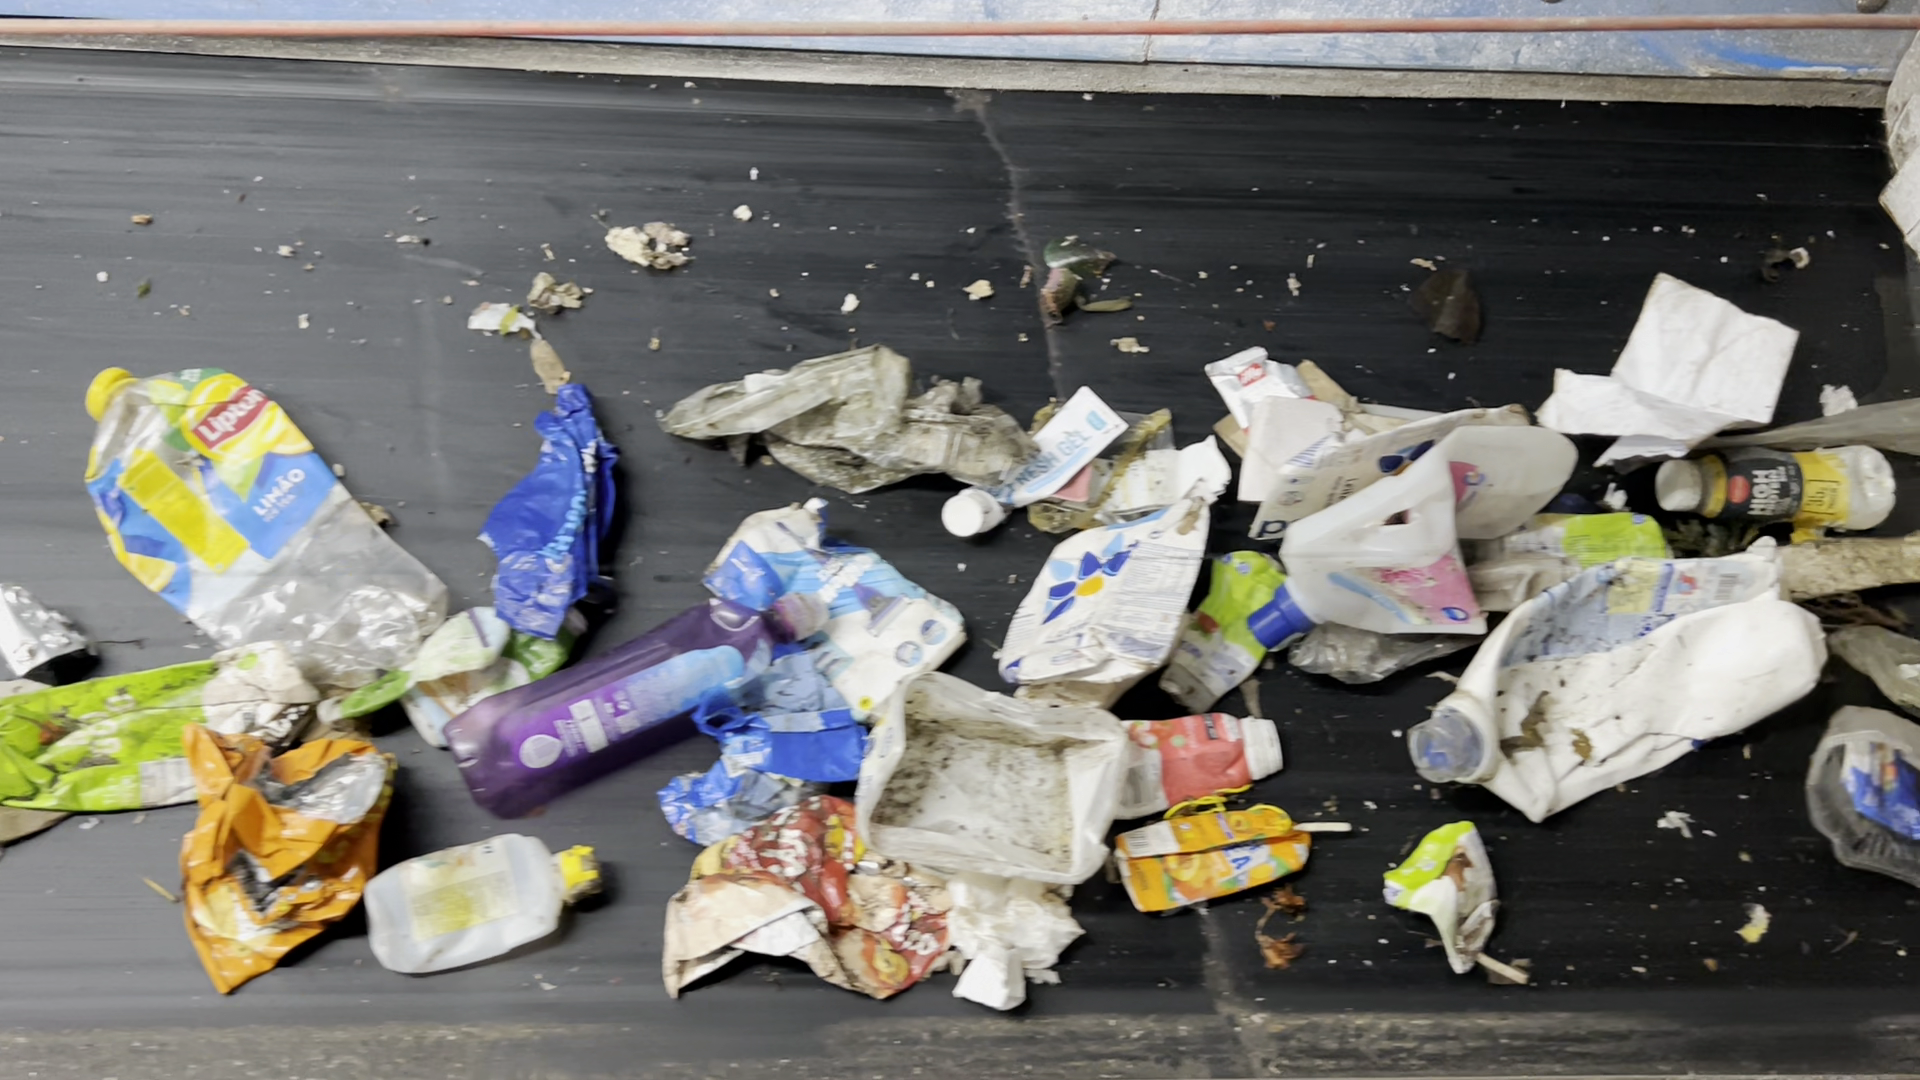
SortWaste is a densely annotated dataset for waste detection created to support research in computer vision for waste management. Collected at an industrial sorting facility, it captures real-world conditions such as cluttered scenes, overlapping objects, and deformed materials, reflecting the visual complexity encountered in operational recycling lines.

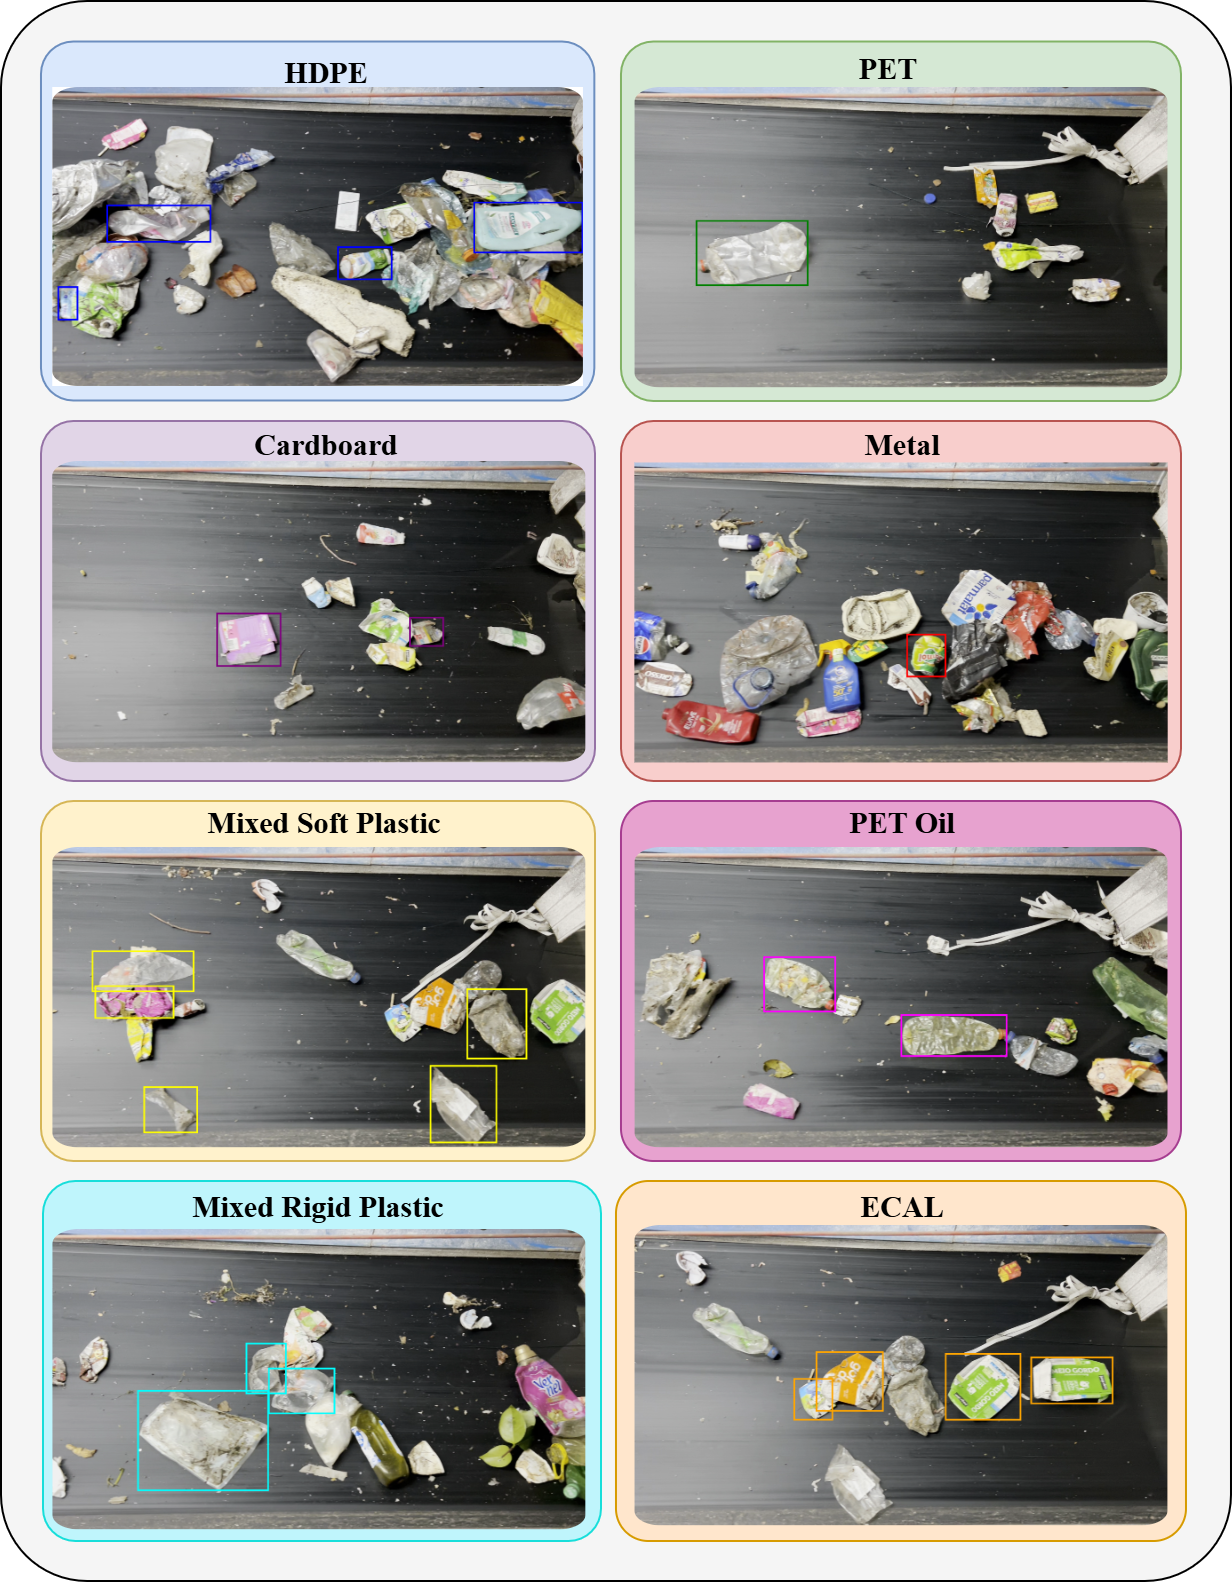
The dataset contains high-quality labeled images across 8 waste categories and a range of environmental conditions. By providing accurate and consistent annotations, SortWaste aims to accelerate the development of automated sorting systems and contribute to more efficient recycling and resource recovery.

Waste Categories

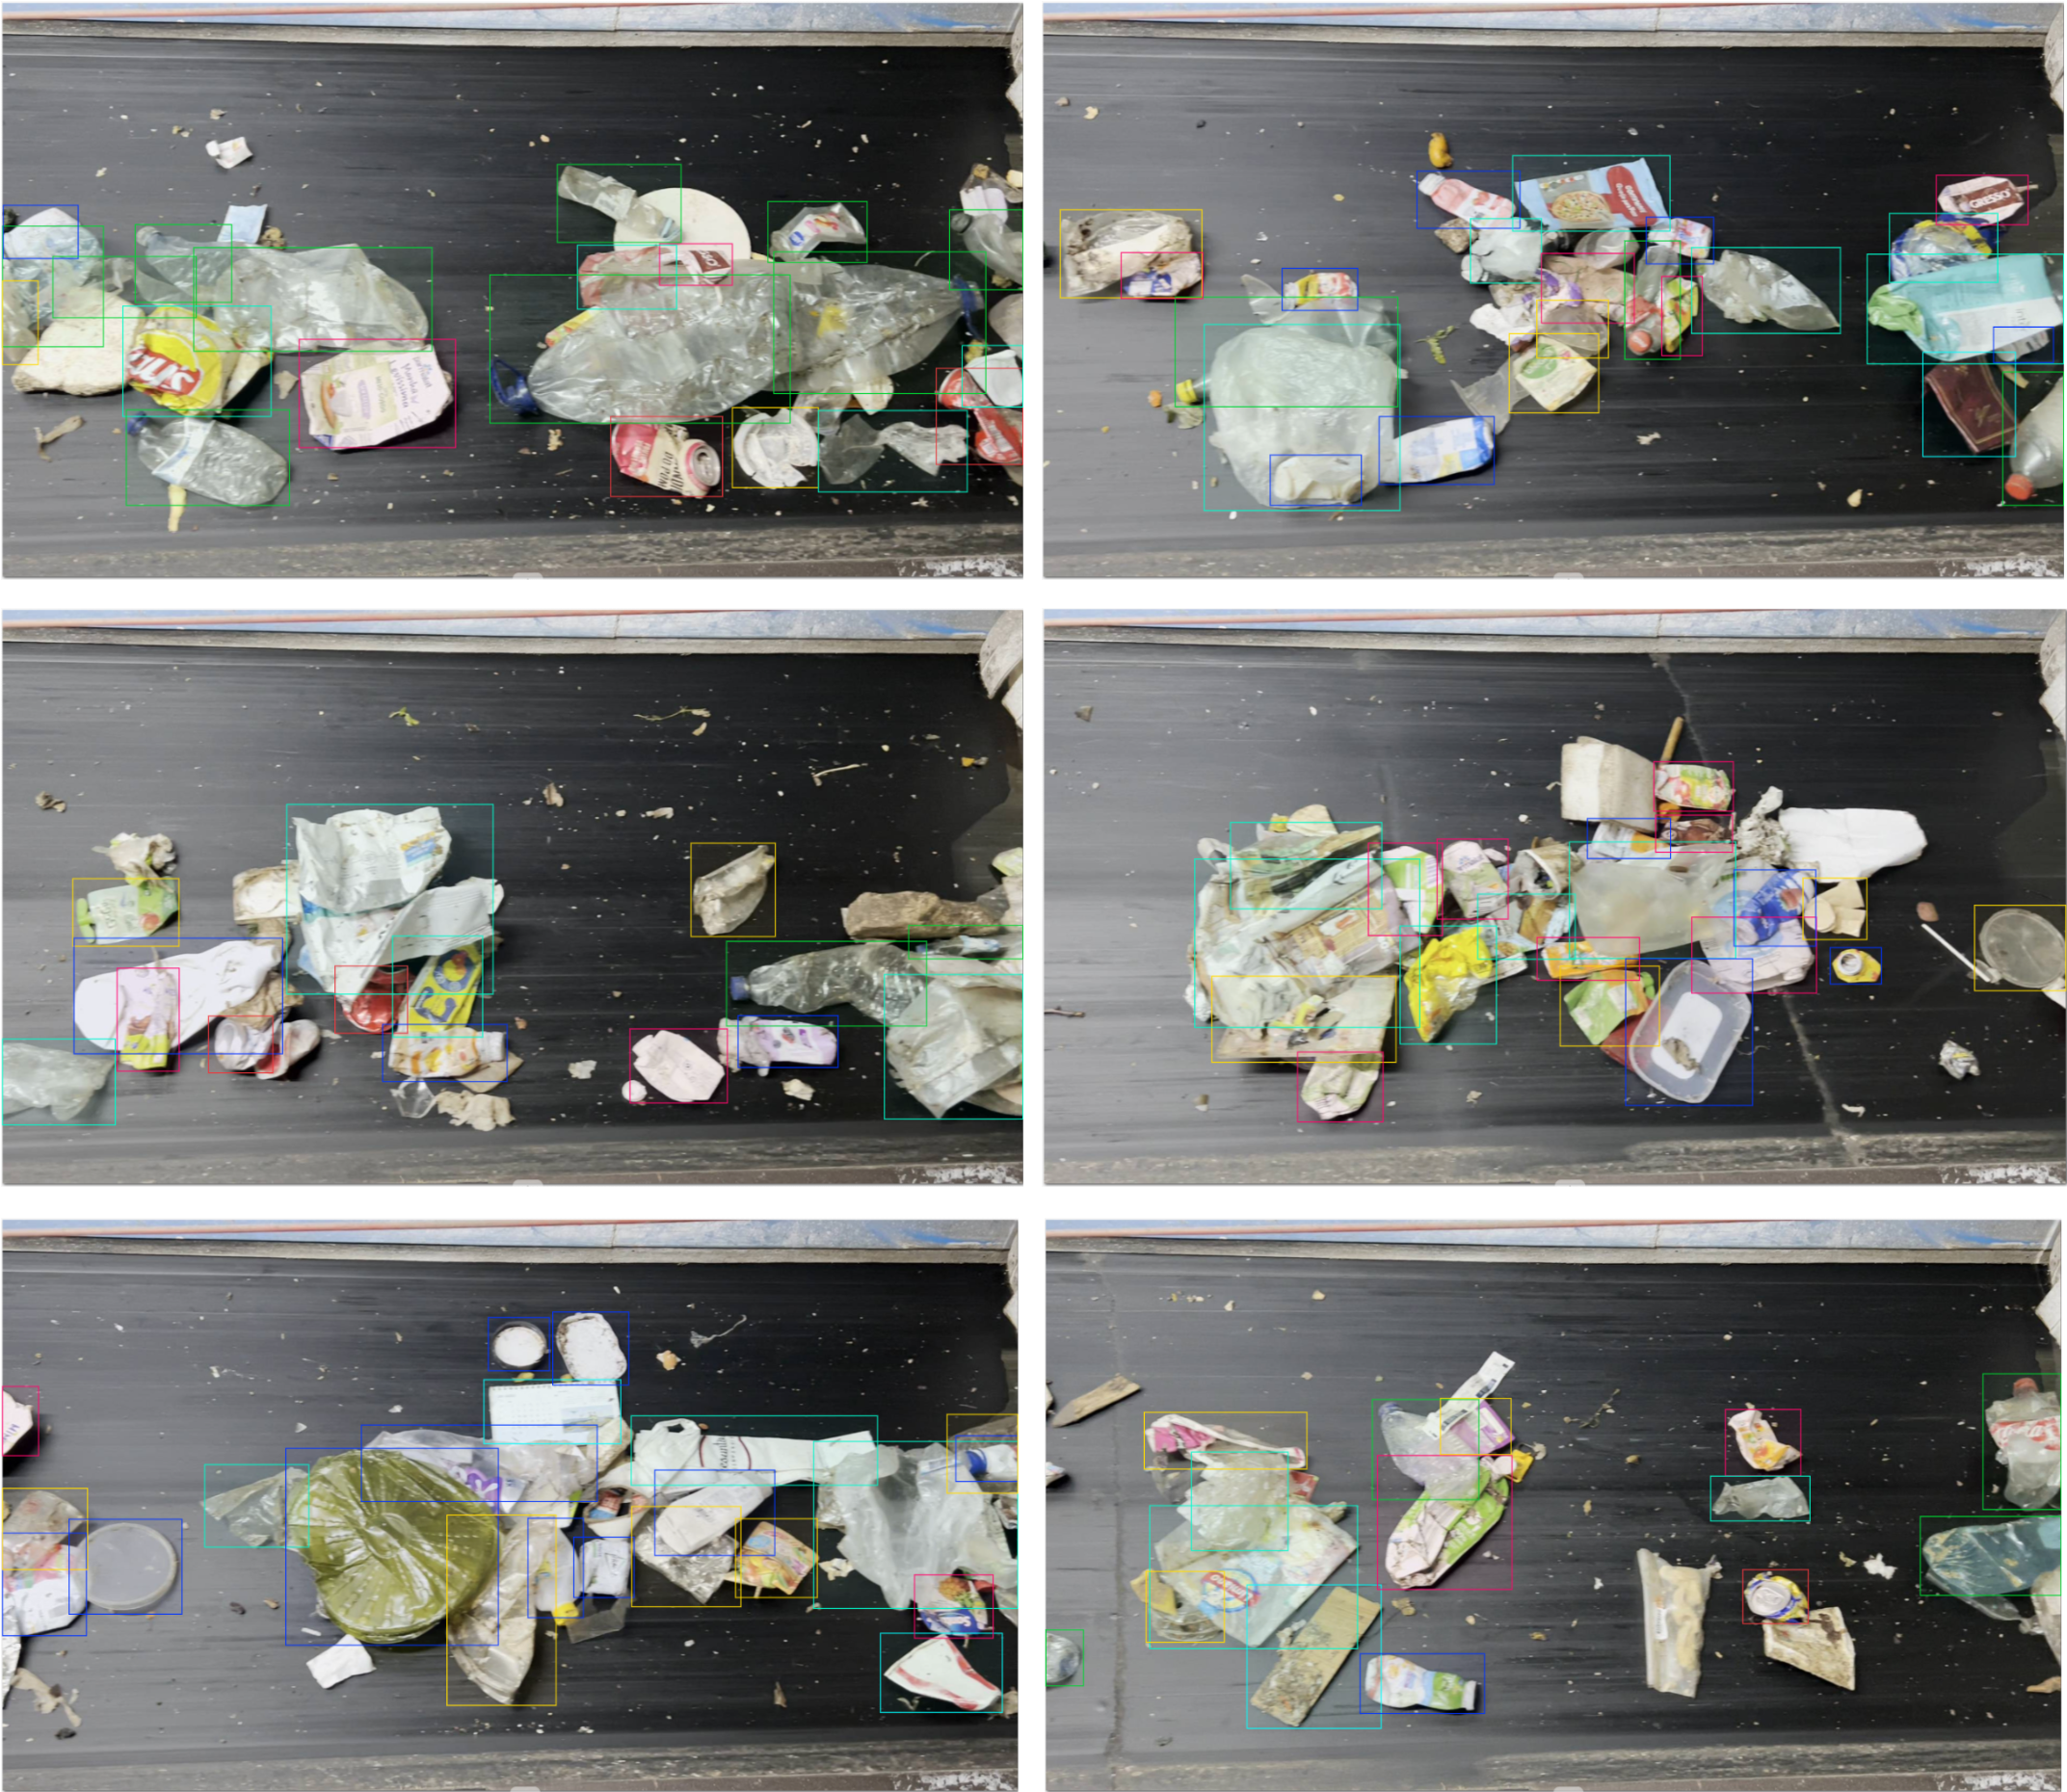
Annotated examples from SortWaste

Data Collection Process

Collection Setup

Top-down capture setup at the sorting line

Industrial Environment

Collected at a Mechanical-Biological Treatment (MBT) facility, the dataset captures waste as it appears on a real conveyor belt:

  • Top-down perspective
  • Real cluttered industrial scenes

Dataset Statistics

Eight types of materials were annotated

  • PET (Polyethylene Terephthalate): rigid, clear or green items, typically bottles, jars, and beverage containers.
  • HDPE (High-Density Polyethylene): opaque, colored, denser plastics such as yogurt cups and bottles for food, hygiene products, detergents, or alcohol.
  • ECAL (Liquid food cartons): multilayer packs with at least 75% cardboard, used for liquids like milk or juice.
  • PET Oil: PET containers for edible oils; treated as a PET subtype due to typical contamination.
  • Mixed Soft Plastic: flexible, compressible plastics (wrappers, chip bags, plastic bags).
  • Mixed Rigid Plastic: rigid plastics not classified as HDPE, often transparent (molded packaging, boxes, hard containers).
  • Cardboard: corrugated or flat packaging used for storage and transport.
  • Metal: steel or aluminum packaging such as cans and food tins.

Examples of all annotated classes

Object counts per class and dataset split

Split HDPE ECAL PET Mixed Soft Plastic Mixed Rigid Plastic Cardboard Metal PET Oil # Images # All Objects
Train 16803 13649 11976 9077 7066 1524 945 802 3705 61842
Validation 4972 2552 2108 1443 1120 425 277 168 780 13065
Test 3269 3026 2722 1817 1230 207 215 132 776 12618
Total 25044 19227 16806 12337 9416 2156 1437 1102 5261 87252

The ClutterScore Metric

We define ClutterScore to gauge the scene’s hardness level using proxies that affect visual complexity:

ClutterScore = α·Hc + β·N + γ·Hs + δ·O
  • Hc (Class entropy): measures class diversity/uncertainty in the scene.
  • N (Object count): number of detected objects in the frame.
  • Hs (Size entropy): variability of object sizes (small vs. large objects).
  • O (Bounding box overlap): degree of occlusion/crowding via overlap between boxes.

For implementation details and parameter settings, please refer to the paper or code.

AP vs Clutter Graph

Complexity Levels Visualization

Very Low Clutter Very Low Clutter
Low Clutter Low Clutter
Medium Clutter Medium Clutter
High Clutter High Clutter

Access the Data

The dataset is available in multiple formats:

  • Original videos (.mp4);
  • The complete dataset before splitting;
  • The dataset with the respective splits, available in COCO and YOLO formats;
  • The dataset containing only plastic classes, also available in COCO and YOLO formats;

Citation

@misc{inácio2026sortwastedenselyannotateddataset,
      title={SortWaste: A Densely Annotated Dataset for Object Detection in Industrial Waste Sorting}, 
      author={Sara Inácio and Hugo Proença and João C. Neves},
      year={2026},
      eprint={2601.02299},
      archivePrefix={arXiv},
      primaryClass={cs.CV},
      url={https://arxiv.org/abs/2601.02299}, 
}